Gold Price Analysis for November 20, 2026: Strong downtrend
Gold (XAU/USD) is trading at $3,544.39, down -1.56% (-$56.10) from the previous day and down -14.14% versus a month ago (from $4,128.04). Over the past year, gold is down -13.02%. The overall technical picture reads “Strong downtrend” (trend score -90 on a scale of -100 to +100).
What Happened Yesterday — and Why
Gold fell 3.64% on Thursday (-$135.82), closing at $3,600.49. The day's range of $168.09 was well above its average daily range of about $84.42 — a big day by gold's standards.
Moves in the US dollar index (DXY +0.04%) and US 10-year Treasury yields (-1 bp to 5.05%) were mixed or small, so they offer only a partial explanation for gold's move.
There was no major US data around the sharpest hourly move (02:00 GMT, -$44.25), so it was more likely driven by order flow and technical levels than by news.
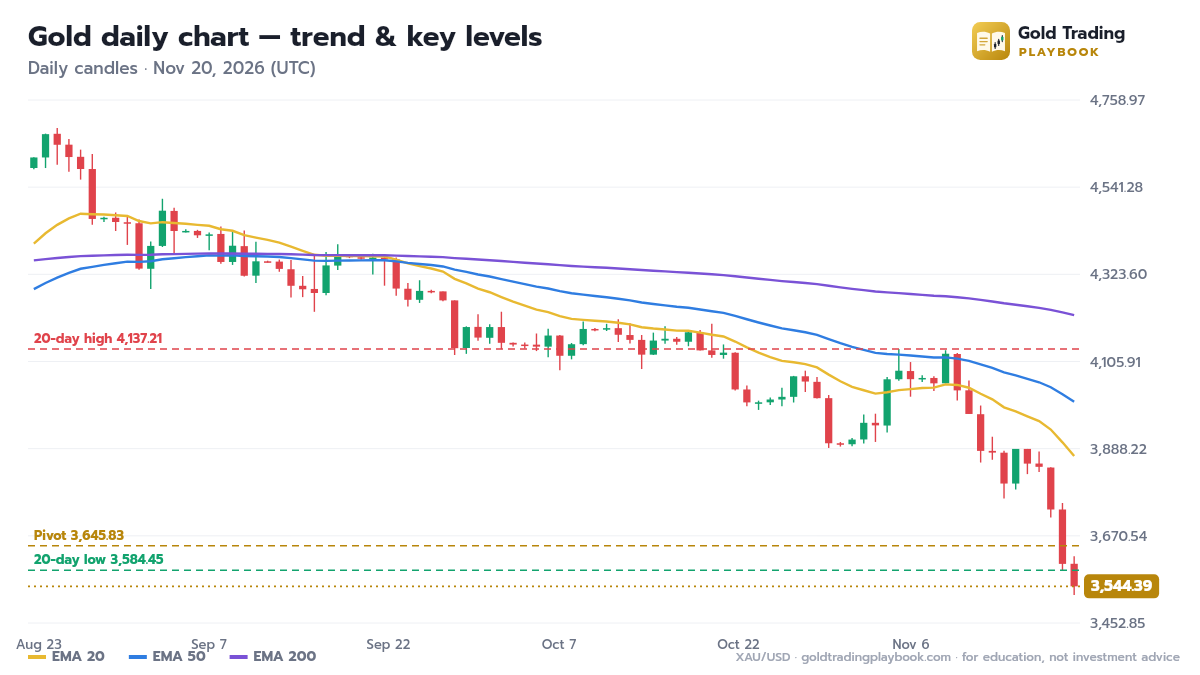
Technically, gold closed below the previous 20-day low ($3,716.58) — a breakdown that often attracts follow-through selling. It is trading below its 20-day EMA ($3,869.81), which now acts as nearby resistance. The daily RSI is 23.4 — oversold — so sharp short-covering bounces are possible even within the downtrend.
Entry Timing
Downtrend, but oversold — don't chase shorts now
Wait for a bounce toward EMA20 (~3,869.81) or resistance at 4,137.21 before looking for a sell
Today's Scenarios
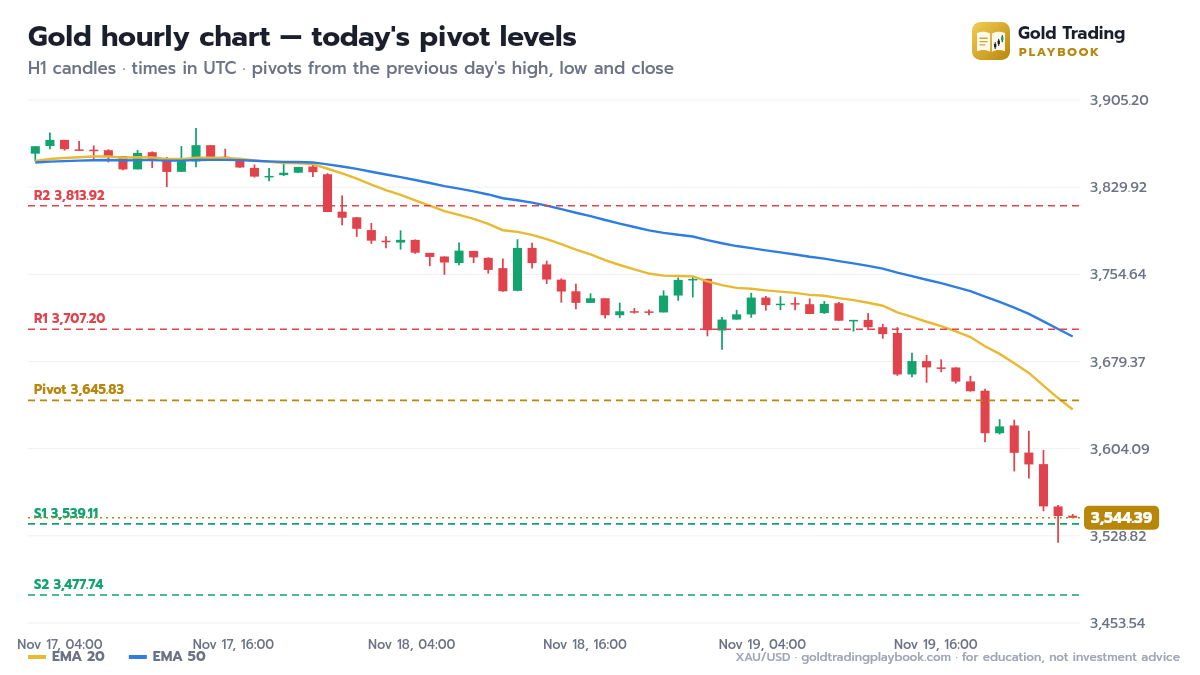
- Bearish scenario: staying below the pivot at $3,645.83 keeps sellers in control; a break below S1 at $3,539.11 targets S2 at $3,477.74 and the 20-day low around $3,522.82.
- Bullish scenario: a recovery back above the daily pivot at $3,645.83 would be the first sign of strength; a break above R1 at $3,707.20 opens the way to R2 at $3,813.92 and the 20-day EMA near $3,869.81. In the current downtrend, treat upside moves as bounces unless price can hold above these levels.
Price is currently below the pivot, so the bearish scenario has the edge for now. Whichever way it breaks, wait for a candle to close beyond the level and size the trade with a stop on the other side.
Economic News to Watch Today (GMT)
| Time | Impact | Event | Forecast | Previous | Effect on gold |
|---|---|---|---|---|---|
| 15:00 | Medium | UoM Consumer Sentiment | 51.7 | 51.0 | Higher than expected → gold usually falls |
| 15:00 | Medium | UoM Inflation Expectations | – | 4.3% | Can swing either way |
Price Comparison
| Period | Price then | Change | % |
|---|---|---|---|
| 1 day | $3,600.49 | -$56.10 | -1.56% |
| 1 week | $3,878.37 | -$333.98 | -8.61% |
| 1 month | $4,128.04 | -$583.65 | -14.14% |
| 3 months | $4,600.00 | -$1,055.61 | -22.95% |
| 6 months | $4,499.27 | -$954.88 | -21.22% |
| Year to date | $4,337.00 | -$792.61 | -18.28% |
| 1 year | $4,074.87 | -$530.48 | -13.02% |
Key Support & Resistance
| Level | Type | Price | Distance from current price |
|---|---|---|---|
| 52-week high | Resistance | $5,650.86 | +59.43% |
| EMA200 | Resistance | $4,221.67 | +19.11% |
| 20-day high | Resistance | $4,137.21 | +16.73% |
| EMA50 | Resistance | $4,005.49 | +13.01% |
| EMA20 | Resistance | $3,869.81 | +9.18% |
| 20-day low | Support | $3,522.82 | -0.61% |
Today's Pivot Points (classic)
| Level | Price | Distance |
|---|---|---|
| R3 | $3,875.29 | 9.34% |
| R2 | $3,813.92 | 7.60% |
| R1 | $3,707.20 | 4.59% |
| Pivot | $3,645.83 | 2.86% |
| S1 | $3,539.11 | -0.15% |
| S2 | $3,477.74 | -1.88% |
| S3 | $3,371.02 | -4.89% |
Gold is currently at about 1% of its 52-week range ($3,522.82 – $5,650.86).
Technical Factors
- Primary trend: Down (negative) — EMA50 (4,005.49) is below EMA200 (4,221.67)
- Price vs EMA50: Below (negative) — Price has broken below the medium-term average
- Short-term trend: Down (negative) — Price is below EMA20 (3,869.81)
- 1-month momentum: -14.14% (negative) — Price is clearly lower than a month ago
- RSI (daily): 23.4 (caution) — Oversold — a bounce is likely
- Distance from EMA20: -3.9 ATR (caution) — Price is stretched far below its average — bounce risk
- RSI (H1, short-term): 14.8 (caution) — Heavily sold short-term — may bounce
- Volatility (14-day ATR): $84.42 (2.38%) (caution) — High volatility — reduce lot size and widen your stop
This article was generated automatically from market data (gold prices, the US dollar index and Treasury yields), the economic calendar and technical indicators. Explanations of why gold moved describe what coincided with the move and are not certain. It is for information only. It is not investment advice. Trading gold carries a high level of risk — do your own research and manage your risk.